complexType BarLayer
diagram mapping_p73.png
namespace http://www.mapinfo.com/midev/service/mapping/v1
type extension of tns:Layer
properties
base   tns:Layer
children tns:VisibilityConstraintList tns:Table tns:Graduation tns:Border tns:CategoryList tns:ChartWidth tns:ChartHeight tns:Opacity tns:SpatialExpression tns:BarBaseSize
attributes
Name    Type    Use    Default    Fixed    Annotation
renderable    xsd:boolean    optional    true      
Disable the rendering of this layer.
description    xsd:string            
The name/description for this layer.
chartType    tns:BarChartType    optional    MULTIPLE      
Describes Bar chart type. MULTIPLE displays one bar for each value while STACKED displays a single bar with different colored bands for each value.
chartEffectType    tns:ChartEffectType    optional    FLAT      
Describes the chart effect type. FLAT means the Bar chart is drawn as a flat rectangle while AS3D means the Bar chart is drawn with shadow.
horizontalAlignment    tns:HorizontalAlignmentType    optional    CENTER      
Horizontal alignment is based on the reference geometry location. If alignment is LEFT, the nine o'clock position of the Bar is at the reference point. If CENTER, the center of the Bar is at the reference point.  If RIGHT, the three o'clock position of the Bar is at the reference point.
verticalAlignment    tns:VerticalAlignmentType    optional    MIDDLE      
Vertical alignment is based on the reference geometry location. If alignment is TOP, the nine o'clock position of the Bar is at the reference point. If MIDDLE, the center of the Bar is at the reference point. If BOTTOM or BASELINE, the six o'clock position of the Bar is at the reference point.
independentScale    xsd:boolean    optional    false      
Specifies whether the data values for the bars should be treated independently.
xOffset    xsd:double    optional    2      
Defines the x-offset for the 3D effect.
yOffset    xsd:double    optional    2      
Defines the y-offset for the 3D effect.
graduated    xsd:boolean    optional    true      
Specifies whether graduation is enabled or disabled for this layer.
description
A Bar Chart layer displays a bar chart at the centroid of each feature retrieved from a table.

attribute BarLayer/@chartType
type tns:BarChartType
properties
use   optional
default   MULTIPLE
facets
Kind   Value   Annotation
enumeration   MULTIPLE
Chart is displayed as a 2D shape.
enumeration   STACKED
Chart is displayed with shadow..
description
Describes Bar chart type. MULTIPLE displays one bar for each value while STACKED displays a single bar with different colored bands for each value.

attribute BarLayer/@chartEffectType
type tns:ChartEffectType
properties
use   optional
default   FLAT
facets
Kind   Value   Annotation
enumeration   FLAT
Chart is displayed as a 2D shape.
enumeration   AS3D
Chart is displayed with shadow..
description
Describes the chart effect type. FLAT means the Bar chart is drawn as a flat rectangle while AS3D means the Bar chart is drawn with shadow.

attribute BarLayer/@horizontalAlignment
type tns:HorizontalAlignmentType
properties
use   optional
default   CENTER
facets
Kind   Value   Annotation
enumeration   LEFT
The left side of the label should be aligned horizontally with the reference geometry.
enumeration   CENTER
The center of the label should be aligned horizontally with the reference geometry.
enumeration   RIGHT
The right side of the label should be aligned horizontally with the reference geometry.
description
Horizontal alignment is based on the reference geometry location. If alignment is LEFT, the nine o'clock position of the Bar is at the reference point. If CENTER, the center of the Bar is at the reference point.  If RIGHT, the three o'clock position of the Bar is at the reference point.

attribute BarLayer/@verticalAlignment
type tns:VerticalAlignmentType
properties
use   optional
default   MIDDLE
facets
Kind   Value   Annotation
enumeration   TOP
The top side of the label should be aligned vertically with the reference geometry.
enumeration   MIDDLE
The middle of the label should be aligned vertically with the reference geometry.
enumeration   BOTTOM
The bottom side of the label should be aligned vertically with the reference geometry.
enumeration   BASELINE

The baseline of the label should be aligned vertically with the reference geometry so that any descenders
in the text sit below the reference geometry. If the label has no baseline this may be handled as equivalent to BOTTOM
description
Vertical alignment is based on the reference geometry location. If alignment is TOP, the nine o'clock position of the Bar is at the reference point. If MIDDLE, the center of the Bar is at the reference point. If BOTTOM or BASELINE, the six o'clock position of the Bar is at the reference point.

attribute BarLayer/@independentScale
type xsd:boolean
properties
use   optional
default   false
description
Specifies whether the data values for the bars should be treated independently.

attribute BarLayer/@xOffset
type xsd:double
properties
use   optional
default   2
description
Defines the x-offset for the 3D effect.

attribute BarLayer/@yOffset
type xsd:double
properties
use   optional
default   2
description
Defines the y-offset for the 3D effect.

attribute BarLayer/@graduated
type xsd:boolean
properties
use   optional
default   true
description
Specifies whether graduation is enabled or disabled for this layer.

element BarLayer/Graduation
diagram mapping_p74.png
namespace http://www.mapinfo.com/midev/service/mapping/v1
type tns:Graduation
properties
minOcc   0
maxOcc   1
content   complex
children tns:ValueAtSize
attributes
Name    Type    Use    Default    Fixed    Annotation
graduationMethod    tns:GraduationMethod       SQUARE_ROOT      
Describes the way the size of the graduated pie chart is calculated.
description
Represents bar graduation.

element BarLayer/Border
diagram mapping_p75.png
namespace http://www.mapinfo.com/midev/service/mapping/v1
type tns:Style
properties
minOcc   0
maxOcc   1
content   complex
description
Describes style used to outline each wedge of the bar.

element BarLayer/CategoryList
diagram mapping_p76.png
namespace http://www.mapinfo.com/midev/service/mapping/v1
type tns:CategoryList
properties
content   complex
children tns:Category
description
Describes all the categories for the Bar layer.

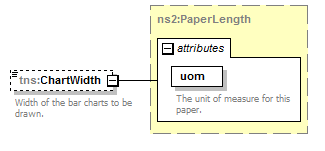
element BarLayer/ChartWidth
diagram mapping_p77.png
namespace http://www.mapinfo.com/midev/service/mapping/v1
type tns:PaperLength
properties
minOcc   0
maxOcc   1
content   complex
attributes
Name    Type    Use    Default    Fixed    Annotation
uom    tns:PaperUnit    required         
The unit of measure for this paper.
description
Width of the bar charts to be drawn.

element BarLayer/ChartHeight
diagram mapping_p78.png
namespace http://www.mapinfo.com/midev/service/mapping/v1
type tns:PaperLength
properties
minOcc   0
maxOcc   1
content   complex
attributes
Name    Type    Use    Default    Fixed    Annotation
uom    tns:PaperUnit    required         
The unit of measure for this paper.
description
Height of the bar charts to be drawn.

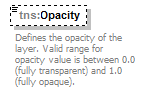
element BarLayer/Opacity
diagram mapping_p79.png
namespace http://www.mapinfo.com/midev/service/mapping/v1
type xsd:double
properties
minOcc   0
maxOcc   1
content   simple
default   1.0
description
Defines the opacity of the layer. Valid range for opacity value is between 0.0 (fully transparent) and 1.0 (fully opaque).

element BarLayer/SpatialExpression
diagram mapping_p80.png
namespace http://www.mapinfo.com/midev/service/mapping/v1
type xsd:string
properties
minOcc   0
maxOcc   1
content   simple
description
Describes the spatial expression.

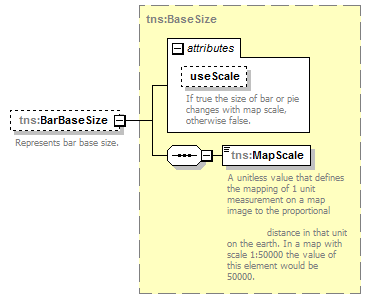
element BarLayer/BarBaseSize
diagram mapping_p81.png
namespace http://www.mapinfo.com/midev/service/mapping/v1
type tns:BaseSize
properties
minOcc   0
maxOcc   1
content   complex
children tns:MapScale
attributes
Name    Type    Use    Default    Fixed    Annotation
useScale    xsd:boolean       true      
If true the size of bar or pie changes with map scale, otherwise false.
description
Represents bar base size.


© 2016 Pitney Bowes Software Inc. Email: pbbi.support@pb.com